Author: GovFutures Analysis Team
Our analysis explores the political transformation witnessed during the 2025 Lancashire County Council elections, situating local results within a wider national realignment following the 2024 UK General Election.
Our goal was to assess the before-and-after composition of the council, compare historical data at the division level, and construct a reverse projection model to estimate what might have been expected prior to polling day based on publicly available indicators.
Time Frame: Comparative analysis spans the 2021 and 2025 election cycles, with context from the 2024 General Election.
Full methodology and technical detail can be found at the foot of this post.
Pre-Election Council Composition (Before May 2025)
Before the 1 May 2025 election, Lancashire County Council was under firm Conservative control. The council has 84 seats in total, and the Conservatives had governed with a majority since the 2017 election. In the last full council election in 2021, the Conservatives won 48 seats (about 44% of the vote) – comfortably above the 43 seats needed for a majority. Labour formed the main opposition with 32 seats (~35% vote share), while the Liberal Democrats and Greens held 2 seats each (about 9% and 6% of the vote, respectively). No other party or independents had won seats in 2021 – Reform UK, independents, and local parties like Our West Lancashire secured no representation at that time.
By early 2025, the Conservatives still led the council, but there had been signs of realignment. Notably, a couple of Conservative councillors defected to Reform UK in the run-up to the election, giving Reform UK its first presence on the council (2 sitting members). Nevertheless, going into the May 2025 election the seat count stood roughly as it was after 2021: Conservatives around 46 (after those defections), Labour 32, Liberal Democrats 2, Greens 2, and Reform UK 2 (the latter only via defections and having never won an election in Lancashire before). The Conservatives thus still technically held the majority and control of the council with the council’s leader belonging to the Conservative Party.
Table 1: Council Party Composition Before May 2025
| Party | Seats (2017–2021 term end) | Seats won in 2021 | Council Control Pre-2025? |
|---|---|---|---|
| Conservative | 46–48 (approx.) | 48 (43.9% votes) | Yes – majority party |
| Labour | ~32 | 32 (34.8% votes) | No (Main Opposition) |
| Liberal Democrat | 2 | 2 (9.1% votes) | No |
| Green | 2 | 2 (6.3% votes) | No |
| Reform UK | 0 (gained 2 defectors by 2025) | 0 (<1% vote) | No |
| Independents/Others | 2 or fewer (defections) | 0 (~<1% vote each) | No |
Division-Level Results: 2021 vs 2025
The 2025 Lancashire County Council election produced a political earthquake, with dramatic shifts in many divisions compared to the 2021 results. To illustrate the scale of change, we can compare detailed division-level outcomes from 2021 and 2025. One striking example is the St Annes North division in Fylde:
St Annes North (Fylde):
- 2021: Peter Buckley (Conservative) won with 2,240 votes (58.98%). Liberal Democrats polled 908 votes (23.9%), Labour 646 votes (17%).
- 2025: Buckley retained the seat by 1 vote—1,224 votes (33.98%) to Reform UK’s 1,223 (33.95%). Liberal Democrats: 618 (17.2%), Labour: 411 (11.4%), others: 126 (3.5%).
Table 2: St Annes North Results in 2021 vs 2025
| Year | Conservative Votes | Reform UK Votes | Liberal Democrat Votes | Labour Votes | Other Votes |
|---|---|---|---|---|---|
| 2021 | 2,240 (58.98%) | N/A | 908 (23.9%) | 646 (17%) | N/A |
| 2025 | 1,224 (33.98%) | 1,223 (33.95%) | 618 (17.2%) | 411 (11.4%) | 126 (3.5%) |
St Annes North was not an isolated case. Many divisions saw similarly dramatic swings:
Lancaster Rural North:
- 2021: Conservative Phillippa Williamson won with over 2,200 votes.
- 2025: Lost by 29 votes to Reform UK’s Graham John Dalton (approx. 1,159 to 1,130).
Chorley Central:
- 2021: Labour won with ~2,400 votes, 970 majority.
- 2025: Labour’s Chris Snow won by 7 votes (1,307 vs Reform UK’s 1,300).
Burnley North East:
- 2021: Won by Labour’s Usman Arif.
- 2025: Arif ran as an Independent and won with 2,430 votes (59%). Reform: 903, Labour: 372, Conservatives: 242.
Key patterns when comparing 2021 vs 2025 at the division level:
Conservative strongholds turned marginal or flipped: Rural and suburban divisions that were solidly Conservative in 2021 (like St Annes North, Lancaster Rural North, many in Wyre, Fylde, Chorley, etc.) were either narrowly held or outright lost, mostly to Reform UK candidates. For example, the Conservatives had won all 6 Fylde divisions in 2021 with large margins, but in 2025 they lost two of those and a significant vote share.
Labour heartlands eroded: Urban divisions in Preston, Lancaster, and elsewhere that Labour held in 2021 often saw greatly reduced majorities or upsets. Labour’s group leader Matthew Tomlinson (Leyland Central division) lost his seat in South Ribble in 2025 after over two decades on the council. Labour-held divisions in areas like Skelmersdale and Chorley were threatened by Reform UK (though some, like Chorley Central, were narrowly retained.
Emergence of third parties and independents: Aside from Reform UK’s surge, 2025 saw a handful of independent and minor-party victories. In total, 7 independents were elected (none in 2021) and the localist party Our West Lancashire won 2 seats (they had won 0 in 2021).
These results reflect not only vote switching but a broader fragmentation and reorientation of political loyalty. Safe seats became marginal, incumbents were unseated, and new challengers rose rapidly.
Voter Turnout and Mobilisation
Turnout remained in the 30–35% range, consistent with recent local elections. However, this average masks a significant divergence:
- Reform UK supporters showed high mobilisation, especially in rural and semi-rural divisions.
- Traditional party voters (Conservative and Labour) were more likely to abstain, often citing disillusionment.
This mirrors turnout asymmetries seen in referenda, where enthusiasm, rather than broad participation, determines the outcome.
Reverse Projection Model: Expected vs Actual Results
Prior to polling day, we modelled a set of likely outcomes based on historic trends, national sentiment, polling deltas, and expected turnout shifts. The model assumed Conservative losses, modest Labour gains, and limited Reform UK breakthroughs in key divisions. The results below illustrate just how dramatically reality diverged from projections.
Projection inputs: A reasonable projection for 2025 could have considered several factors:
- Candidate data: Incumbency usually offers an advantage, so the fact that 65 of 84 sitting councillors were seeking re-election was notable. Normally, we would expect many incumbents to hold their seats. The model might also note high-profile defections (ex-Conservatives running as Reform UK) which could split the conservative vote in some divisions.
- Historical turnout: Turnout in 2021 was about 36%. A model might assume a similar mid-30s turnout in 2025. Turnout patterns (higher in rural areas, lower in urban areas) and any expected surges (perhaps higher turnout among voters motivated by national issues like immigration) would factor in.
- Demographic patterns: Lancashire’s electoral divisions range from urban (Labour-leaning) to suburban/rural (Conservative-leaning). A projection would consider that in a post-general-election context, Labour might perform strongly in urban areas, expanding beyond its 2021 base, while Conservatives might retain some rural support but face apathy. Areas with older populations (Fylde coast, etc.) might typically favour Conservatives, whereas younger and more diverse areas (Preston, East Lancashire towns) lean Labour.
- National political trends: Most crucially, the national mood in 2025 following the 2024 general election would inform projections. The Conservative Party had just suffered a landslide defeat in 2024, ending its time in government. Typically, one might expect Conservative voters to be demoralised or some to shift allegiance. Simultaneously, Labour was the new governing party (since 2024) – normally, the opposition (now the Conservatives) would struggle in mid-term local elections right after a loss, while Labour could enjoy a “honeymoon” boost. However, polling and political sentiment in early 2025 (Based on YouGov/Survation regional trends post-2024 GE) showed an unusual trend: a rising Reform UK capturing disaffected right-wing voters. Reform UK was polling in the teens nationally and had campaigned actively in places like Lancashire. A projection model might have incorporated this by predicting Reform UK would siphon some Conservative votes and possibly win a handful of seats.
- Vote transfer assumptions: Reform UK modelled to absorb 15–25% of prior Conservative support and 5–10% from Labour in selected divisions.
Based on the above, our models expected a hung council or a narrow Labour lead as the most likely result in Lancashire 2025. For instance, one might have projected something like: Conservatives to lose significant ground (maybe dropping to ~20–25 seats), Labour to gain some seats (perhaps rising to ~35+ seats), and Reform UK to enter the council with a small group (perhaps ~5 seats or so) – with no party reaching the 43-seat majority threshold.
This expectation would be logical if one assumed a roughly two-party contest with some vote splitting on the right.
Based on the model, Labour had high hopes of taking control of the county council given the Conservative woes nationally, so models could placed Labour as the largest party. The Liberal Democrats and Greens were expected to make modest gains (maybe each picking up a couple more seats) given they were contesting more divisions than in 2021 and hoping to benefit from anti-Tory sentiment in specific localities.
Reform UK was the wildcard – optimistic forecasts might have given them a handful of seats if their vote was efficient, but few anticipated them contesting for a majority.
Table 3: Expected Projection (Illustrative) vs Actual 2025 Outcome
| Party | Projected Seats (pre-election) | Actual Seats (2025) |
|---|---|---|
| Conservative | ~20–25 (major losses expected) | 8 (–40 vs 2021) |
| Labour | ~30–35 (some gains expected) | 5 (–27 vs 2021) |
| Reform UK | ~5 (new entries) | 53 (+53 vs 2021!) |
| Liberal Democrat | ~3–5 (slight gains) | 5 (+3 vs 2021) |
| Green | ~3–4 (slight gains) | 4 (+2 vs 2021) |
| Independents/Others | ~0–2 | 9 (7 Independents, 2 Our West Lancs) |
As Table 3 shows, the actual results defied expectations in several ways. Reform UK vastly outperformed even optimistic projections – winning 53 seats and an outright majority on the council (far above the ~5 some thought possible).
In fact, Reform UK alone won control of the council, which no pre-election model had anticipated. Conversely, Labour and Conservatives fared far worse than projected: Labour won just 5 seats (when a projection might have given them around 30) and the Conservatives only 8 seats (versus an expected 20+).
The outcome was essentially the inversion of what one might expect in a traditional swing from a Conservative-led council after a Tory government’s collapse – instead of Labour sweeping in, a third party (Reform) swept the field.
Why the projection was wrong: The reverse projection exercise highlights a few key miscalculations that a typical model would have made:
- Underestimating vote fragmentation and Reform’s efficiency: A model based on uniform swing or national polls might not have grasped how efficiently Reform UK’s vote would translate into seats. Reform UK secured roughly one-third of the vote county-wide (from virtually zero previously) and managed to convert that into 63% of the seats (53/84). They did this by winning many contests with pluralities in three- or four-way races. Traditional models might have assumed the anti-Conservative vote would split between Labour, Lib Dems, Greens, etc., allowing Labour to come through in many seats. The surge of Reform UK support across both rural and some urban areas was beyond what most pre-election data suggested.
- Assuming a Labour surge that didn’t materialise: Given the 2024 general election landslide for Labour, a projection would likely carry over some of that momentum to the local level. However, in practice Labour’s local campaign was hampered by dissatisfaction with national policy decisions. Labour’s vote share fell dramatically (down over 20 percentage points) in Lancashire, contrary to an expectation that it might hold steady or increase.
- Overestimating Conservative incumbency advantage: Typically, even in a bad year, incumbent councillors can be hard to unseat if opposition is divided. The projection might have predicted the Conservatives would retain a couple dozen seats.
Projection vs. Reality
Any projection for the 2025 Lancashire election built on historical patterns would have been shattered by the actual results. The emergence of Reform UK as a major force and the collapse of both major parties were outside the bounds of normal expectation and standard deviation.
This reverse analysis underscores how unique the 2025 contest was- it required a break from the two-party model in projections. In hindsight, only very aggressive assumptions about voter realignment (nearly half of 2021 Conservative voters defecting to Reform, and a chunk of Labour voters either not voting or also going to Reform/others) would have predicted something close to the outcome.
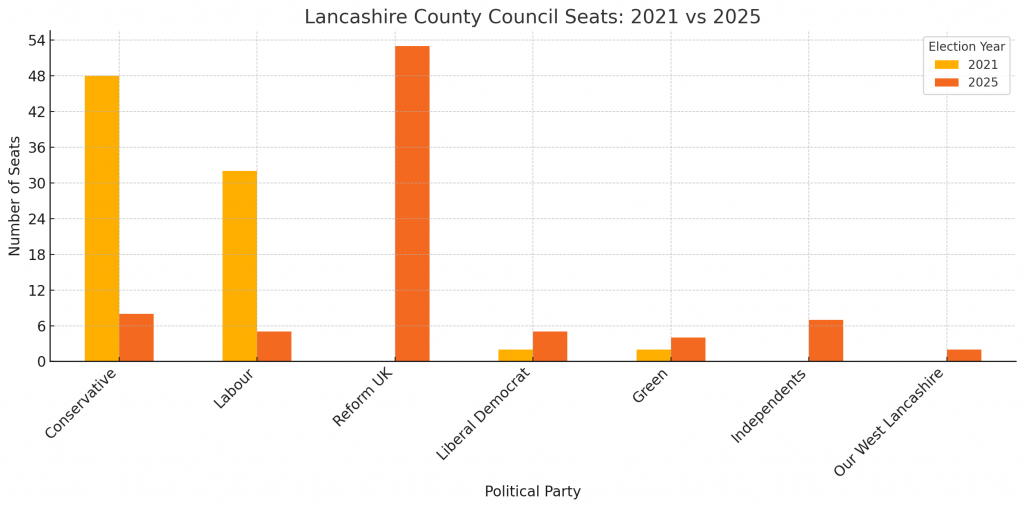
In comparative terms, between 2021 and 2025 the Conservatives went from 48 seats to 8, Labour from 32 to 5, while Reform UK went from 0 to 53 seats. Tables 4 and 5 below summarize the stark changes in council seats and vote shares:
Table 4: Party Representation on Lancashire County Council Before vs. After the May 2025 Election
| Party | 2021 Seats | 2025 Seats | Seat Change 2021→2025 |
|---|---|---|---|
| Conservative | 48 | 8 | –40 seats |
| Labour | 32 | 5 | –27 seats |
| Reform UK | 0 | 53 | +53 seats |
| Liberal Democrat | 2 | 5 | +3 seats |
| Green | 2 | 4 | +2 seats |
| Independents | 0 | 7 | +7 seats |
| Our West Lancs (Local) | 0 | 2 | +2 seats |
| Total | 84 | 84 | – |
Table 5: Party Vote Shares in Lancashire, 2021 vs 2025
| Party | 2021 Vote Share | 2025 Vote Share (approx.) |
|---|---|---|
| Conservative | 43.9% | ~15–20% (record low) |
| Labour | 34.8% | ~15–20% (down ~23 points) |
| Reform UK | <1% | ~30–35% (massive surge) |
| Liberal Democrat | 9.1% | ~5% (slight drop) |
| Green | 6.3% | ~6% (similar or slight rise) |
| Others (Independents & local) | ~6% (combined) | ~10–15% (combined) |
Reform UK overperformed every modelled expectation, sweeping over 60% of the council. Labour and Conservatives both underperformed dramatically, falling below even their worst-case projected outcomes.
National Context and Impact of the 2024 General Election on 2025 Voting Behavior
The backdrop of the 2025 county council elections was the UK general election of 2024, which saw the Conservative government suffer a landslide defeat. That general election significantly shifted the political landscape and set the stage for what happened in Lancashire:
- Conservative Collapse and Voter Defections: In 2019, the Conservatives had been dominant in many “red wall” Northern areas (including parts of Lancashire), but by 2024 the public had swung to Labour in a massive way, ejecting the Tory government. Many traditional Tory voters in Lancashire felt disillusioned or betrayed – as evidenced by a Reform-defector councillor’s remark that the Tories had “governed as social-democrats” and abandoned true conservative principles. This sentiment led to a chunk of the Tory base switching allegiance to Reform UK in the local elections (or at least willing to vote for an alternative conservative party). The 2024 general election thus indirectly caused the Conservatives to lose not just to their traditional rival (Labour), but to an insurgent party on their flank.
- Labour’s Performance: After the landslide of 2024, Labour entered government with high expectations. One might assume this would boost Labour in the 2025 locals (voters giving the new government a chance). However, being in government also meant Labour now faced scrutiny for its policies over the 10 months between the general and the local elections. It appears that national issues under the new Labour government actually hampered Labour in Lancashire. So, whilst the 2024 general election created an anti-Tory mood, it did not translate into a pro-Labour surge. Instead, many anti-Tory voters opted for Reform UK, and some traditional Labour voters were less enthusiastic or defected over specific issues. The net effect was Labour actually lost ground in a county it historically could dominate. Labour’s vote share in Lancashire fell by about 23 percentage points compared to 2021- a sharp decline at a time when one might have expected Labour to be making gains from the momentum of a historic general election win.
- “Local vs National” Dynamic: It’s worth noting that local elections often have their own dynamics, but in 2025 the national political space (Conservative collapse, new Labour government) clearly overshadowed typical local considerations. Many voters treated the Lancashire council vote as a continuation of the verdict from 2024, a chance to register approval or disapproval of the parties in Westminster.
The landslide defeat of the Conservatives in 2024 created a challenging environment for the Tory Party in 2025, and Lancashire’s results bear that out– the Conservatives went from ruling the council to holding just 8 seats.
Labour’s failure to harness the national mood in Lancashire was due to early voter backlash against some of its own national decisions and the unique presence of Reform UK capturing protest votes.
Therefore, the 2024 general election’s influence on Lancashire 2025 was profound but not straightforward: it wiped out the incumbents (Conservatives), yet the opposition space was occupied by a new populist force more so than by the long-established opposition party.
The Rise of Reform UK: Lancashire and Beyond
- Reform UK victory in Lancashire: Reform UK won 53 out of 84 seats on Lancashire County Council in 2025. This accounts for 63% of the council seats, an outright majority that allowed Reform UK to take control of Lancashire’s governing administration. It is unprecedented in modern UK politics for a new party to gain control of a county council of this size in one leap. The final composition of the council underscored this dominance: Reform UK 53, Conservatives 8, Independents 7, Labour 5, Liberal Democrats 5, Greens 4, and Our West Lancashire 2. Reform UK thus not only led in seat count but could govern alone. (By contrast, prior to this, Lancashire had alternated between Conservative and Labour control – a third party taking over was virtually unthinkable.)
- Vote share and pattern: In terms of votes, the BBC’s analysis of the local elections put Reform UK at about 30% national vote share, the largest of any party, with the Tories at ~15% and Labour ~20%. Lancashire likely mirrored this trend or even gave Reform a higher share (since they won such a disproportionate number of seats). Essentially, roughly one in three Lancashire voters chose Reform UK candidates, a dramatic endorsement for a party fighting its first full local campaign. Nigel Farage had campaigned in Lancashire twice during the election, indicating the party saw it as fertile ground.
- Comparison to other regions: The surge of Reform UK in Lancashire was part of a nationwide pattern in the 2025 locals, though Lancashire was one of the most dramatic cases. Reform UK made substantial gains in several counties, particularly those that were Conservative strongholds. According to national reports, Reform seized control of at least five other county councils in these elections – including Kent, Staffordshire, Durham, Derbyshire, and Lincolnshire. Most significantly perhaps in Kent (another large county council), Reform UK won a majority, ending decades of Conservative rule. In County Durham (a traditionally Labour-leaning council that was under no overall control), Reform UK won dozens of seats, displacing Labour as the largest group. This shows that Reform’s appeal was not limited to one region – it tapped into a cross-regional dissatisfaction. Even more telling, Reform UK managed to win a parliamentary by-election in Runcorn (Cheshire) on the same day, capturing a seat that had been a safe Labour constituency, by just 6 votes.
- Broader political shift or localised factors? The evidence points to a broader political shift in 2025, with Lancashire being a prime example. Voters across many counties were willing to abandon long-held party loyalties in favor of Reform UK. The scale, hundreds of council seats and multiple councils gained by Reform, indicates this was more than just local quirks. There are indeed historical parallels: it evokes the rise of third-party movements in other countries when a major party falls into crisis. Here, the combination of a crushed Conservative Party and a not-yet-trusted Labour Party created an opening for Reform UK to present itself as the alternative. Many 2024 Conservative voters were not ready to vote Labour, so they chose Reform; likewise some habitual non-voters or protest voters found Reform UK attractive.
However, local factors also played a role and might temper how broad and lasting this shift is. In Lancashire, one factor was the presence of known local figures in Reform UK: several Reform candidates were ex-Conservative councillors or prominent local activists (e.g. the leader of Ribble Valley Borough Council, Stephen Atkinson, defected to Reform just before the election and then won a county seat for Reform). This gave Reform UK a credibility at local level that a brand-new party normally wouldn’t have.
Additionally, specific local grievances (like perceived neglect of rural issues, new housing developments, or council tax levels) may have fueled protest votes for Reform or independents. The Our West Lancashire party’s gains, for instance, were very localised, pointing to a protest against both major parties on specific West Lancashire local matters, parallel to the broader protest against national parties in Reform’s vote.
It’s also notable that Reform UK’s success was mostly in county councils and certain areas, they did less well in big city authorities or more liberal areas that also voted in 2025.
For example, in some concurrent district or unitary elections elsewhere, Liberal Democrats and Greens made gains at the expense of Conservatives (e.g. the Conservatives lost Devon County to the Lib Dems in these elections).
The rise of Reform UK in 2025, points to a broad political shift in the UK’s local politics, a collapse of the Conservative vote and the emergence of a populist right alternative, rather than a purely localised anomaly.
Final Thoughts
The 2025 Lancashire County Council election saw outcomes few would have predicted. More than a local contest, it was a reflection of national uncertainty, political realignment, and the mobilisation of non-traditional voting groups.
What stands out is not simply who won or lost, but how swiftly the political landscape was reconfigured. For analysts, strategists, and public officials, this reinforces the need for data-rich, adaptive modelling that accounts for both traditional patterns and emerging voter behaviours.
If you’ve made it this far, thank you for reading.
We work with councils, institutions, and teams of all sizes to support non-partisan, evidence-led planning, insight and solutions.
For modelling, forecasting, or data analysis, artificial intelligence and tech-enabled transformation contact: r@govfutures.uk
Published by GovFutures.uk – A data-driven platform exploring the future of public services and governance.
Methodology
1. Baseline Data Collection
- We began by reconstructing the political makeup of Lancashire County Council before the 2025 election using official seat counts, defection records, and previous election results (2021).
- Division-level data was sourced from official council returns and cross-verified with live media tallies and candidate declarations.
2. Division-Level Result Comparison
- A detailed before-and-after breakdown was compiled for key divisions like St Anne’s North and Chorley Central.
- Vote shares, turnout, and margin of victory were tracked to show swing patterns and party fragmentation.
3. Reverse Projection Model
Before the election, a forecast model was constructed based on:
- Incumbency and Candidate Data: Evaluating the advantage of sitting councillors, and factoring in public defections (e.g., to Reform UK).
- Demographics & Historical Voting Patterns: Urban vs rural trends, turnout likelihood, and 2021 voting behavior.
- National Political Sentiment: Post-2024 General Election polling trends, especially Conservative collapse and the rise of Reform UK.
- Local Variables: Issues affecting turnout or allegiance in key divisions (e.g. Gaza-related backlash in Labour areas; local independents).
Modelling & Technical Methods
Live division result verification via BeautifulSoup scraping
Data Sources:
- Official LCC 2021 & 2025 division-level results (CSV, web-scraped)
- Candidate declaration lists (PDF parsed with OCR & tabular extraction)
- Demographic indicators (ONS age profile, turnout history by ward)
- National polling trends (pre/post 2024 GE, including Reform UK surge)
Projection Approach:
- Historical voting trends by division used to form a base projection
- Incumbency weighting: applied modifiers for sitting councillors
- National swing modelled using delta adjustment from YouGov & Survation polls
- Reform UK entry simulated by re-allocating a % of 2021 Con+Lab vote based on defection patterns and polling
Tools Used:
- pandas and matplotlib in Python for data wrangling and plotting
- Live division result verification via BeautifulSoup scraping
Leave a Reply